Misleading Means: On Drugs and Discrimination
How do you estimate the prevalence of HIV among drug addicts? In a perfect (though somewhat Orwellian) world you’d have a giant list of all drug users, and you’d randomly select a subset of them to test for HIV. Alas, the world is messy, and we’re left to less rigorous methods, for example time-location sampling, where surveyors recruit drug users from the local “shooting gallery” (heroin users’ version of a crack house) at randomly selected times.
A few years ago, sociologists Doug Heckathorn and Matthew Salganik proposed a new approach to surveying these so-called hard-to-reach or hidden populations: respondent-driven sampling. RDS is a variant of snowball sampling—where existing study participants recruit the next wave of participants, usually in exchange for payment—with a few clever tweaks. Matt and Doug realized that popular drug users (i.e., those with a lot of friends) are disproportionately likely to be in the final snowball sample, for the simple reason that popular users know more people who could potentially recruit them. In RDS, recruits are thus down-weighted by the number of people they know. In just a few short years, RDS has already been applied in more than 20 countries, and it is currently used by the Centers for Disease Control and Prevention (CDC) to help track the HIV epidemic in the United States. Now for the bad news: Matt and I just wrote a paper showing that RDS may not be suitable for key aspects of public health surveillance where it is now extensively applied.
Our critique of RDS boils down to a simple empirical reality: outcomes are typically not typical. To give an example, while the mean household income in the United States is around $60K, half of households earn either less than $30K or more than $100K. In other words, households typically have incomes that are far from typical. So what does this have to do with RDS? The trick of down-weighting popular drug users guarantees—albeit under strong assumptions—that RDS will on average yield the true infection level. (In statistical parlance, RDS is an asymptotically unbiased estimator.) In the RDS community, this theoretical property was widely interpreted as meaning that RDS is a generally reliable method of estimation. What we show is that even in situations where RDS estimates are correct on average, these estimates are typically so far from the truth that meaningful statistical inference is difficult. To clarify the point, suppose we estimate the mean age in New York by sampling one person uniformly at random. Even though our estimate would be perfect on average (i.e., unbiased), it could hardly be called accurate. Since RDS participants tend to know, and hence recruit, people who are similar to themselves, this caricatured example is actually not so far from the truth about why RDS estimates are so volatile.
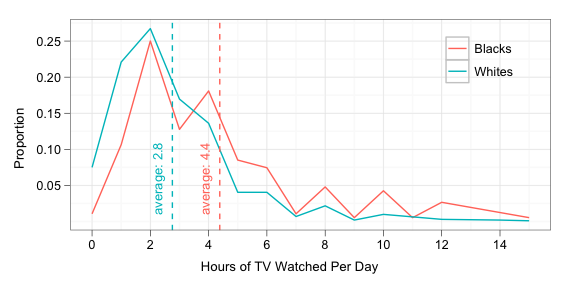
I suspect that this tendency to neglect the variance also plays a role in discriminatory attitudes. Consider the following statistic, culled from the 2008 General Social Survey: white Americans on average watch 2.8 hours of television daily, compared to 4.4 hours watched on average by black Americans. The difference in group means is large, both on a relative scale—blacks on average watch nearly 60% more television than whites—and on an absolute scale—1.6 hours a day. (Citing a similar statistic, conservative radio host, and Rush Limbaugh protege, Michael Medved has pontificated on the subject.) Now, if you’re walking down the street and you see a random black person and a random white person, how likely is it that the black person watches more TV? Given the large group differences, you might be tempted to conclude it’s pretty likely. As it turns out, however, individual variation is so large that it’s basically a coin flip (about 60%) as to who watches more TV—in other words, race is a poor cue. The plot below makes this phenomenon visually apparent: despite the substantial difference in group means, whites and blacks have distributions of TV watching that are tough to distinguish. Just as in RDS, the means are misleading.
NB: For more details on RDS, check out our paper.
Illustration by Kelly Savage: A stylized depiction of an RDS recruitment tree, where nodes correspond to sample members and links indicate who recruited whom. Based on an RDS study of drug users in New York City, presented in Abdul-Quader, et al, 2006.


