How Close is Close

Your team is down by a couple of baskets going into the final minutes of the game. Is it time to panic or is it still anyone’s to win? Plenty have certainly come back from apparently dire situations. Just last month the Lakers beat the Thunder in double overtime after being down by 11 points with four minutes on the clock. In fact, such comebacks have led the renowned sport statistician Bill James to conclude that with four minutes remaining it’s not really over unless the gap is at least 19 points.[1] Spectacular reversals of fortune may be rare, but conventional wisdom holds that a lot can and does happen in that last quarter.
“An NBA team leading by twice the square root of minutes left in the game has an 80% chance of winning.”
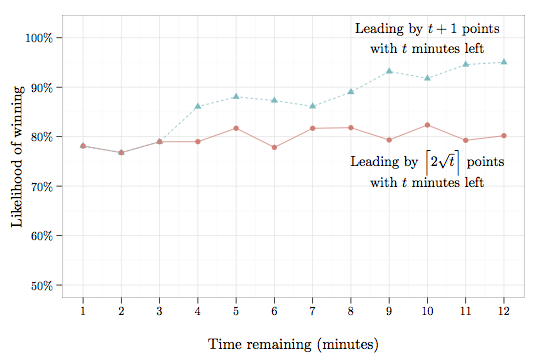
As explained by Moneyball author Michael Lewis, “one statistical rule of thumb in basketball is that a team leading by more points than there are minutes left near the end of the game has an 80% chance of winning. If your team is down by more than 6 points halfway through the final quarter, and you’re anxious to beat the traffic, you can leave knowing that there is slightly less than a 20 percent chance you’ll miss a victory.” While that’s a compelling heuristic, an analysis of over 7,000 games over the last six seasons reveals that it only holds for a few short minutes, losing accuracy even by the six-minute mark in Lewis’s example. A better rule of thumb is that a team has an 80% chance of winning if they lead by twice the square root of minutes left. Going into the final quarter (12 minutes) of the game, for example, that 80% threshold is achieved at \(2\sqrt{12} \approx 7\) points. By comparison, the standard heuristic suggests a substantially larger gap of 13 points is required to achieve an 80% chance of success.

Why does the square root rule work? Basketball games can be reasonably well modeled as a series of independent one-minute rounds consisting of approximately one possession for each team. In each interval, the score differential between the teams changes by about two points, with each team roughly equally likely to win that round. In statistical terms, the intervals are approximately mean 0 with standard deviation 2. The central limit theorem then shows that with \(t\) minutes remaining, the score gap changes approximately according to a normal random variable with mean 0 and standard deviation \(2\sqrt{t}\). (By contrast, the rule of thumb Lewis cites implicitly — and incorrectly — assumes randomness increases linearly in time.) Since it is unlikely a team will make up a one standard deviation deficit (i.e., \(2\sqrt{t}\) points), a lead of at least that much is relatively safe.
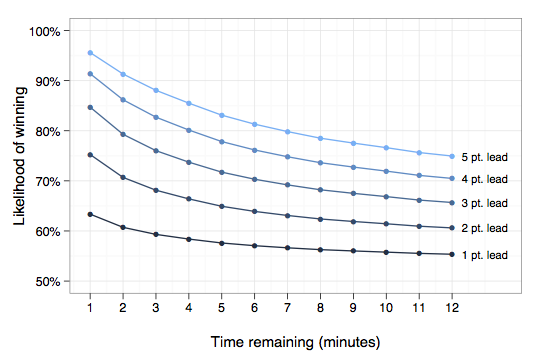
It’s perhaps surprising that a seemingly modest seven-point deficit is difficult to recover from with a full quarter of play remaining. Granted, coming back 20% of the time is not exactly a snowball’s chance in hell (more like the chance of sunshine in Juneau, in December), but it’s certainly not an enviable position to be in. The data further show that even starting the fourth quarter down just five points does not bode well, with only a 1 in 4 chance of success.

At least anecdotally, there appears to be a general sense that entering the final stretch down a few points is not a big deal; it’s still a “close” game and anything can happen. Understanding the effects of such deceptively minor deficits, however, could lead to better strategic play. For example, a team that correctly recognizes their low likelihood of success may attempt riskier plays so as to increase the randomness of the game and in turn boost their chance of winning. Alternatively, realizing the point gap amassed in the first three quarters is in fact quite consequential, teams may increase their intensity of play earlier on. But who really knows if such armchair statistical strategies would actually work in practice? Certainly not me — I’ve never even played a proper game of basketball — but that hasn’t stopped me from blogging about it before!
Footnotes
[1] Strictly speaking, James’s rule was intended for college — not professional — basketball, but I suspect he would arrive at a similar estimate for NBA games.
Illustration by Kelly Savage. Data obtained from BasketballValue.com. Thanks to Kiran Limaye, Dave Pennock, Matt Salganik, and Sid Suri for teaching me that basketball is the one in which you try to put the 2-sphere through the 1-sphere.

I took the liberty of fitting an equation that gives the probability that a team will win if it’s d points ahead with t seconds left on the clock:
$$frac{1}{2} text{erfc}left(-frac{d}{sqrt{2} left(-0.0010607 t^2+0.0642438 t+1.61989 sqrt{t}+1.26336right)}right)$$
There’s confounding between the two teams having different skills, and having different scores. It seems like dreeves’s fit would be useful for real-time betting if you don’t know who’s playing whom, but if you do know their relative strengths, couldn’t you do better?
@Johnicholas It’s true that the scores reveal some information about team strength, and thus the change in score gap is not quite mean 0. But since the mean is relatively small compared to the standard deviation, the approximation is still reasonable, as the first plot shows. I certainly agree, though, that you could do better by including factors such as team strength, home court advantage, and which team has possession of the ball.
Great article. Thanks for the formula Daniel. How did you end up with that functional form? I would suspect the two next most important pieces of information would be the point spread and the over-under which together give an expected number of points scored by both teams.
The final point difference is a gaussian with mean equal to the current point difference and standard deviation a function of the time remaining. So the erfc thing is for the CDF of a gaussian and the standard deviation (that varies with time remaining) is the ugly function of t in the denominator.
Sharad fit the standard deviation for every possible amount of time remaining, based on actual game data, and I just did a fit of those fits with the functional form you see in the denominator there. It’s just something that made the probability plots match.
I was trying to convince Sharad to include the formula in the post but he thought it was too ugly (true) or to include a widget for calculating the win probability, which he thought was too infopornographic. Here’s a stab at a widget for infoporn fetishists (or basketball bettors):
http://www.wolframalpha.com/widgets/gallery/view.jsp?id=4ad006788f860656e4fc1b8dda045d78
Exactly. For instance, which team is actually the better team and which team is playing at home may have something to say about this. I put together a model for the Blazers for the 2009-2010 season that suggested when the Blazers were playing at home, they were able come back with a higher probability than when they were on the road. This was just one team in one season, but a more thorough, league-wide analysis may reveal the same conditional expectations.
Thanks for providing this formula Daniel but for the life of me I can’t get it to work properly in Excel. Do you have any suggestions on how I can make it work? I will put in assumptions like 450 seconds remaining and up 5 pts and it will return a value close to 49%. I really want to figure this out.
Does Excel know the erfc function? If not you could find an approximation of it: http://en.wikipedia.org/wiki/Error_function
Yeah, Excel has the ERFC function. I also tried it in Google docs and got the same result. All my results end up being close to 50% no matter what time and score assumptions I use. Uggggg
Maybe this could help dial in the issue. If I use the assumptions of a 5 point lead and 300 seconds left and only use the part of the equation after 1/2 ERFC, I get 7.54%. If that matches your results then the issue is clearly with my ERFC function. Is that what your equation gives you?
Oh! I bet my formula is for number of minutes, not seconds.
Yeah, here’s WolframAlpha confirming that’s true:
http://www.wolframalpha.com/input/?i=plot+1/2+Erfc%5B-%285/%28Sqrt%5B2%5D+%281.26336+%2B+1.61989+Sqrt%5Bt%5D+%2B+0.0642438+t+-+0.0010607+t%5E2%29%29%29%5D+from+1+to+12
I’ll edit my comment above. Thanks for catching that!
(Good thing Sharad didn’t let me include that in the post or it would’ve cost me $20 for the typo bounty!)
Ok, glad I wasn’t losing my mind. Now I have this new problem because neither versions of Excel prior to 2010 or Goog Docs can calculate ERFC functions when x is a negative number. Do you have any suggestions of calculators I can use to easily use this formula?
Thanks for taking the time to respond to my messages.
Lots of options! Simplest might be WolframAlpha. Note also the widget I linked to in the comments above.
This article and research is all based on the last 12 minutes of a game. Is there any reason that this equation wouldn’t work just as well for the rest of the game? For example, would it be accurate after calculating 30 minutes left along with the current point margin?
Yes, this approach could be used to make predictions earlier in the game as well. But the earlier you attempt to apply it, the better it would be to incorporate additional sources of information. For example, the current method suggests both teams have an equal likelihood of winning at the beginning of the game (before either team has scored), because it doesn’t incorporate factors such as team strength or home court advantage.
The heuristic outlined in this post is simply a fun rule-of-thumb for making predictions while you watch the game. If the goal is to achieve the best possible possible predictive accuracy, I’m sure one could do much better.
Lead changes at interval???…… How is it that one team wins a quarter say eg; score; 37 – 18, then next quarter the opposition comes out and wins the next quarter say 38 – 17…??? then next quarter the other team comes out and wins the next??? WTF????……is there a advantage or rule or whatever that makes it like that or not. If a higher ranked team is aging a lower ranked to then you’d think it would win every quarter, right?