Forecasting Elections with Dirty Data

During the 1936 U.S. presidential campaign, the popular magazine Literary Digest conducted a mail-in election poll that attracted over two million responses, a huge sample even by today’s standards. Unfortunately for them, size isn’t the only thing that matters. Literary Digest notoriously and erroneously predicted a landslide victory for Republican candidate Alf Landon. In reality, the incumbent Franklin D. Roosevelt decisively won the election, with a whopping 98.5% of the electoral vote, carrying every state except for Maine and Vermont. So what went wrong? As has since been pointed out, the magazine’s forecast was based on a highly non-representative sample of the electorate — mostly car and telephone owners, as well as the magazine’s own subscribers — which underrepresented Roosevelt’s core constituencies. By contrast, pioneering pollsters, including George Gallup, Archibald Crossley, and Elmo Roper, used considerably smaller but representative samples to predict the election outcome with reasonable accuracy. This triumph of brains over brawn effectively marked the end of convenience sampling, and ushered in the age of modern election polling.
A lot has happened since 1936 and the subsequent golden years for representative polling. Response rates for so-called random digit dial telephone surveys — the work horse of representative sampling — have plummeted into the single digits, ostensibly because the novelty of talking to pollsters and telemarketers has worn off, and the technical means to filter out unwanted calls have proliferated. As a result, it’s increasingly difficult and expensive to reach a representative sample of likely voters. At the same time, online, opt-in surveys have made it feasible to poll large numbers of people at relatively low cost. The caveat, of course, is that such online surveys attract a highly non-representative crowd, reminiscent of the Literary Digest debacle.
To better understand the benefits and limitations of non-representative polling, Wei Wang, David Rothschild, Andrew Gelman and I recently tried our hand at forecasting elections with a highly unconventional set of poll responses.[1] During the 45 days leading up to the 2012 U.S. presidential election, David ran an opt-in, daily online poll on the Xbox gaming platform, asking people which presidential candidate they supported (Obama or Romney), as well as basic demographic information about themselves. The poll garnered over 750,000 responses, but the respondents were far from representative of the electorate. In particular, only 7% of responses were from women. Eager not to repeat statistics history, we used one of Andrew’s tools of choice, Multilevel Regression and Poststratification, or Mr. P for short, to correct for the extreme demographic skew of our sample. The idea behind Mr. P is to first partition the population into thousands of demographic cells. For example, one such cell might correspond to 18-29 year-old, white Republican women living in California. We then use the sample to estimate candidate support within each cell. Since many of the cells are sparse — or even empty — we use multilevel regression, which improves estimates by effectively borrowing strength from demographically similar cells. Finally, in the poststratification step, the cell-level estimates are aggregated by weighting each cell by its (estimated) proportion in the electorate.[2]
“With proper statistical adjustment, non-representative polls yield accurate election forecasts, on par with predictions based on traditional representative sampling.”
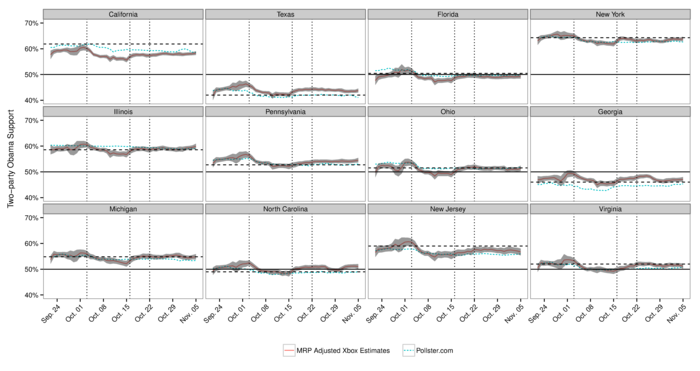
The two graphs below show a sampling of our results. The first one plots estimates of Obama support over the last 45 days of the campaign for the 12 states with the most electoral votes. The red line shows the Mr. P adjusted Xbox estimates (with a 95% confidence band), the blue line shows estimates from Pollster (one of the leading sources for election forecasts, based on traditional polling), the dotted horizontal line indicates the ultimate election outcomes, and the three dotted vertical lines correspond to the presidential debates. Though it’s difficult, if not impossible, to definitively assess accuracy in the weeks or months before election day, the Xbox estimates are broadly consistent with Pollster. Moreover, on the day before the election, across the 51 electoral college races, the Xbox estimates are on average less than 2 percentage points off from the eventual outcomes. Thus, it seems that with proper statistical adjustment, non-representative polls yield accurate election forecasts, on par with predictions based on traditional representative sampling.
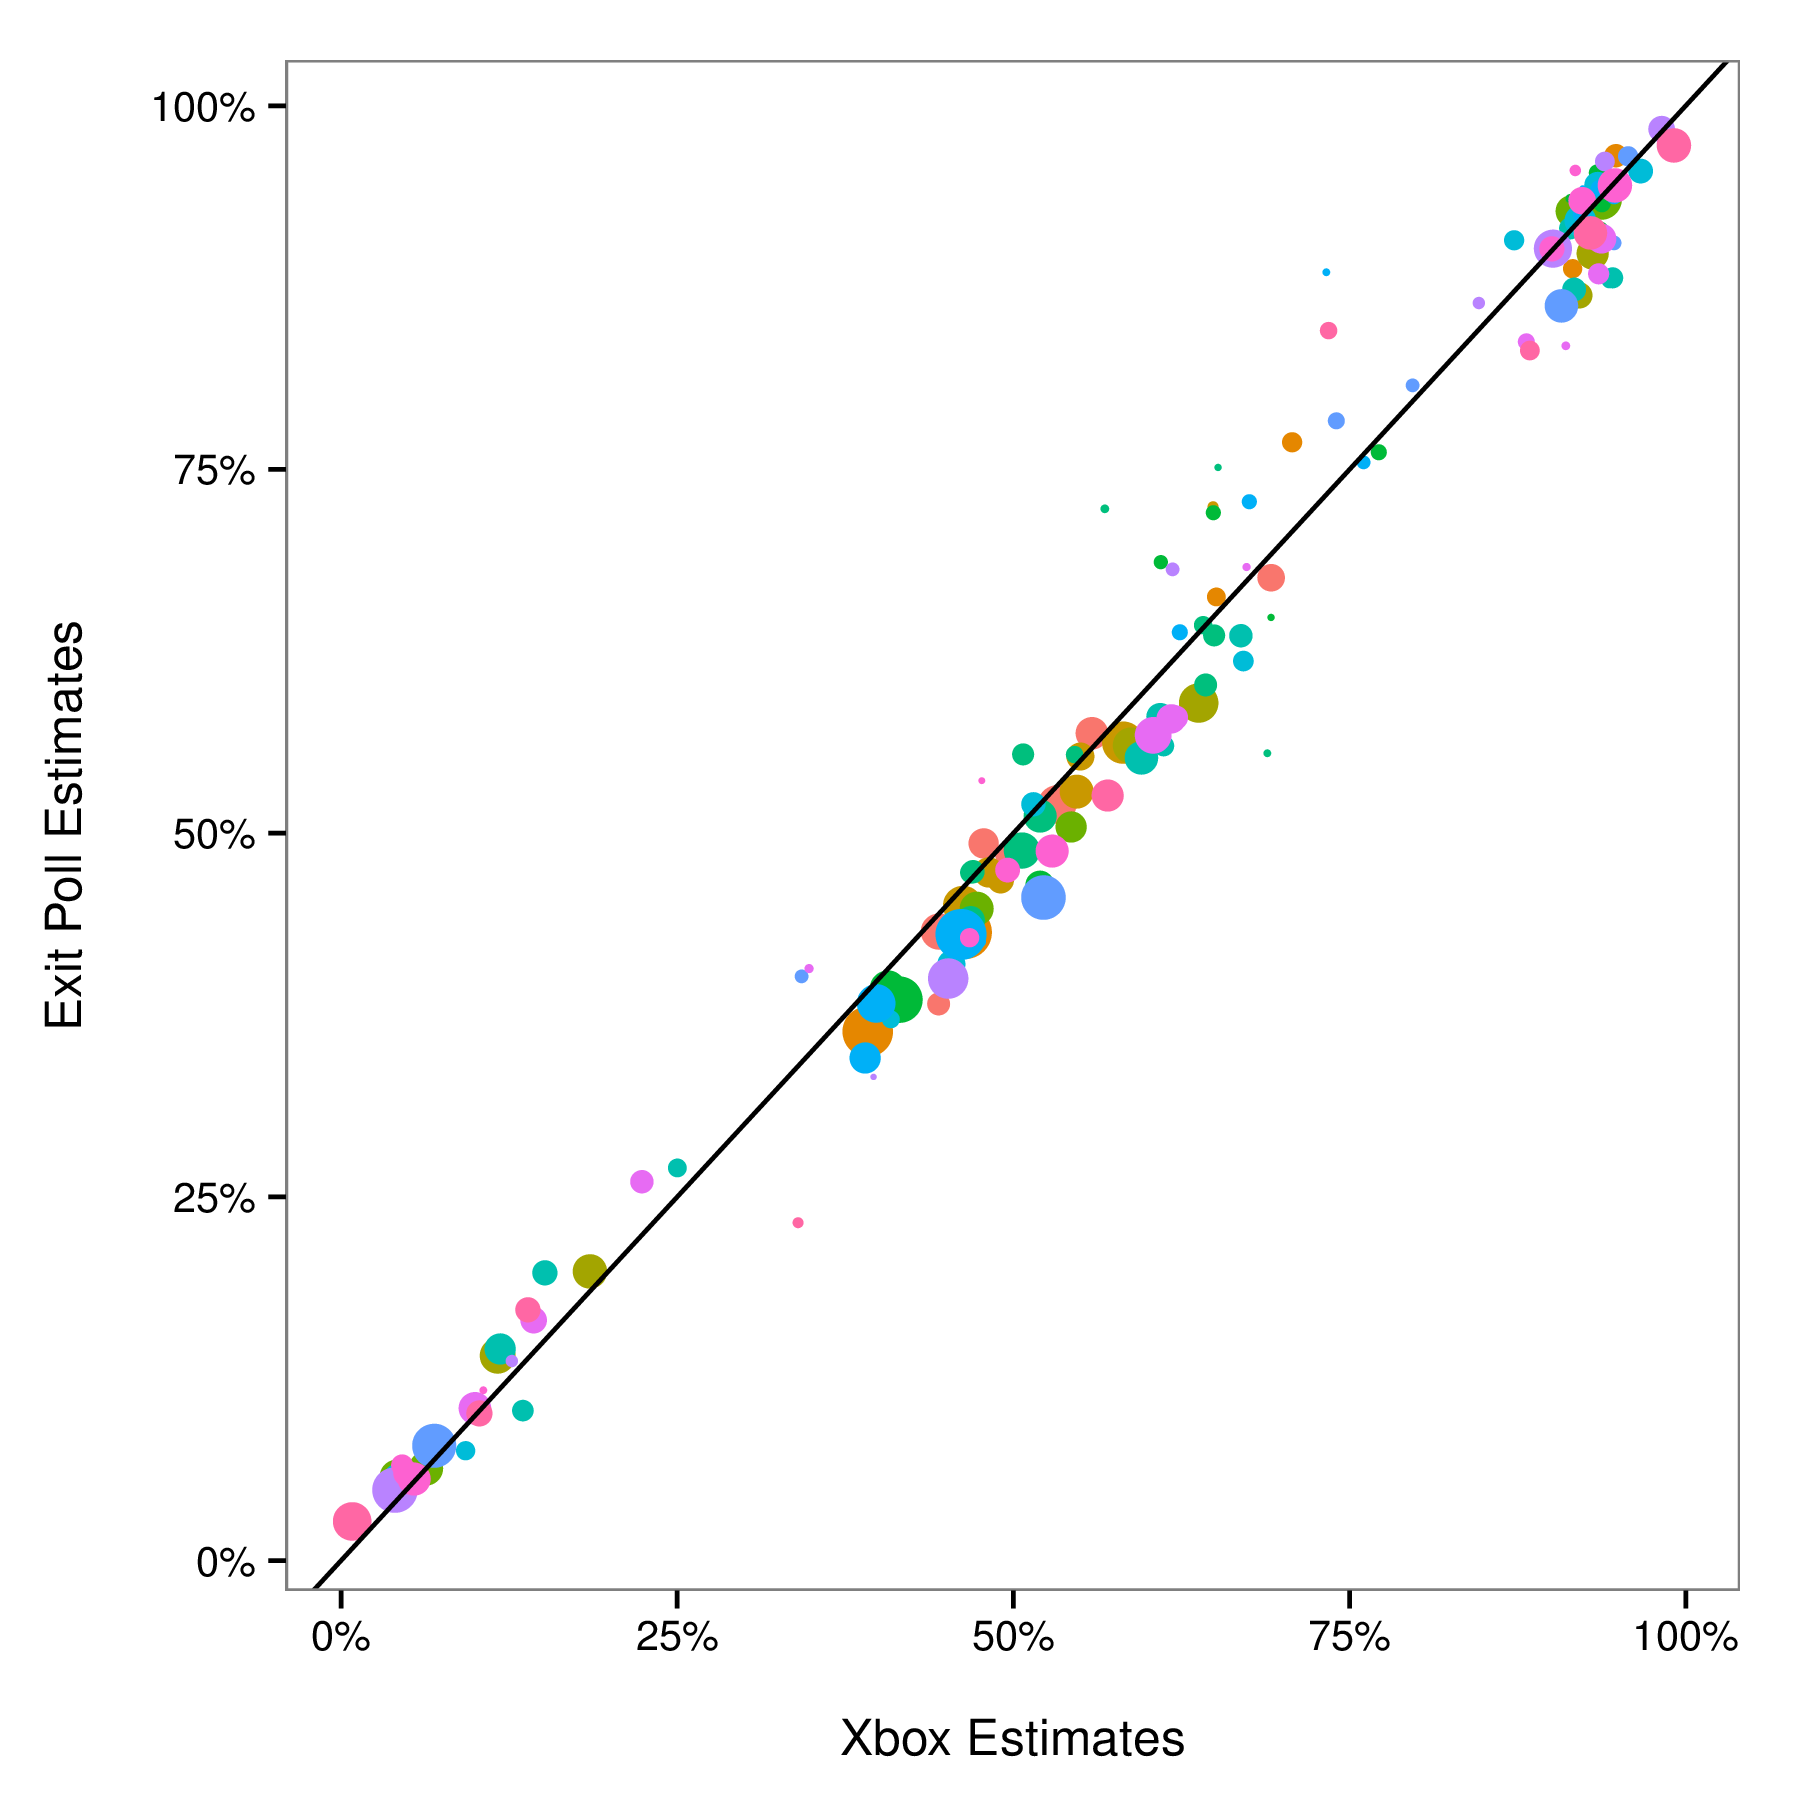
It’s nice and perhaps surprising that we can use highly skewed data to estimate state-level outcomes. But what about other subpopulations? Can we estimate the views of older women, for example, on a platform that caters to young men? The figure below addresses this question, plotting estimates of Obama support for all two-dimensional demographic subgroups (e.g., 18-29 year-old Hispanics, and liberal college graduates) obtained from Xbox the day before the election, and from the exit polls, which proxy for the ground truth. The Xbox estimates are remarkably similar to those from the exit polls. In particular, for women who are 65 and older — a group whose preferences one might a priori believe are hard to estimate from the Xbox data — the difference between Xbox and the exit polls is a mere one percentage point.

Non-representative polls offer the potential for fast, cheap, and accurate estimates, and with ever declining response rates for traditional polls, we may soon have no other choice. 75 years after the Literary Digest failure, non-representative polling — with appropriate statistical adjustments — is due for a second act.
For further details, see our forthcoming paper, Forecasting Elections with Non-Representative Polls.
Illustration by Kelly Savage
Footnotes
[1] Since we analyzed the data after the 2012 election was over, we did not technically make forecasts. But I swear we didn’t cheat!
[2] Estimating the composition of likely voters is itself a difficult task. For transparency, simplicity, and replicability, we assume the composition of the 2012 electorate mirrors that of the 2008 electorate, as estimated via exit polls.

