Finding the Market Bottom
Given the tumultuous state of the global economy, a lot of people are naturally wondering whether the worst is over. A quick scan of recent headlines shows that plenty are weighing in on the question. Morgan Stanley is boldly claiming, “Bear Market Is Not Over: Selling Today.” James Paulsen, chief investment strategist with Wells Capital Management, is more optimistic, telling The Street there are many positive signs we have hit the bottom.
Despite pretty serious predictions by pretty serious people, I am inclined to believe John Kenneth Galbraith’s famous quip that, “the only function of economic forecasting is to make astrology look respectable.” In particular, in accordance with the efficient market hypothesis, today’s asset prices should be approximately the best predictor of near-term future prices. If this weren’t true and you could find a better predictor, you’d be drinking mojitos on your own private island. And in the process of filling your treasure chest, you would have “corrected” the market, so that your one-time divining rod would become, well, just an ordinary rod.
But perhaps I’m taking these prognostications too literally. Forecasts that the market has or has not bottomed out may, quite reasonably, be statements more about volatility than about direction. That is, bears and bulls may agree that on average the market will stay where it is, but disagree over the likelihood of a big swing in prices.
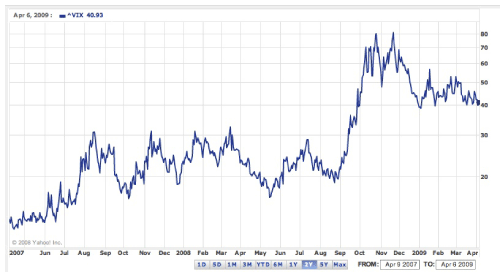
By this volatility measure, the outlook is “bearish.” When investors believe the market is highly volatile, stock options are relatively expensive, since large fluctuations increase the chance they will expire “in the money.” Consequently, one can infer the implied market volatility from current options prices. The Chicago Board Options Exchange Volatility Index (or VIX), is a popular gauge of this implied volatility, and is based on a blend of options prices for stocks in the S&P 500. The current index value of 42 represents an expected annualized change (up or down) of 42 percent in stock prices over the next 30 days. Thus, the expected change in prices over the next month is 42%/√12 months = 12%.
12 percent monthly volatility is quite high. To put this in perspective, two years ago the VIX suggested around 12 percent annualized volatility (3.5% monthly)—the expected monthly volatility today is the same as the expected annual volatility two years ago. And the market doesn’t expect itself to stabilize in the near future. A futures contract on the VIX for six months from now is trading at around 38. That is, investors believe the November 30-day forward looking annualized volatility will still be about 38 percent.
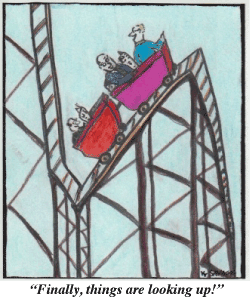
So if you believe the market’s introspection, prepare for a bumpy ride.
Illustration by Kelly Savage


